VSCode · Open VSX Forks

Quality signal,
right where you code.

Inline decorations and hover cards are free. CodeLens complexity scores, the dashboard webview, and Desktop companion ship with Pro.

Works with

VSCodeCursorWindsurfAntigravityVSCodiumKilo Code
  • 42

    React Anti-Patterns

    What am I doing that ESLint never told me?

    Surfaces the patterns that pass review and bite later: inline Context.Provider values, side effects in render bodies, premature memoization, array-index keys in dynamic lists, components defined inside other components. None of these are caught by react-hooks/exhaustive-deps.

  • 64

    Hook Integrity

    Will this re-render correctly, or am I one dep away from a stale closure?

    Audits useEffect, useMemo, and useCallback dependency arrays plus hook-ordering violations. Catches the bugs that pass review and surface three sprints later as 'intermittent.'

  • 78

    Type Safety Coverage

    How much of this file is the compiler actually checking?

    Tracks any, unknown leaks, non-null assertions, and unsafe as casts as a share of typed surface area. 94% means the compiler has your back. 71% means you're shipping JavaScript with a .ts extension.

  • 58

    Server/Client Boundary

    Did I just send the whole import tree to the browser?

    Flags unnecessary 'use client' on leaf pages, non-serializable props crossing the Server → Client boundary, and async client components. The bugs are invisible to TypeScript and only show up as bundle bloat or runtime crashes in production.

  • 51

    Maintainability

    Is this file going to fight me when I change it?

    Combines volume, complexity, and lines of code into one score with a known formula (MI). Expand for the components.

Inside the panel

A score per metric group. Expand for the raw numbers.

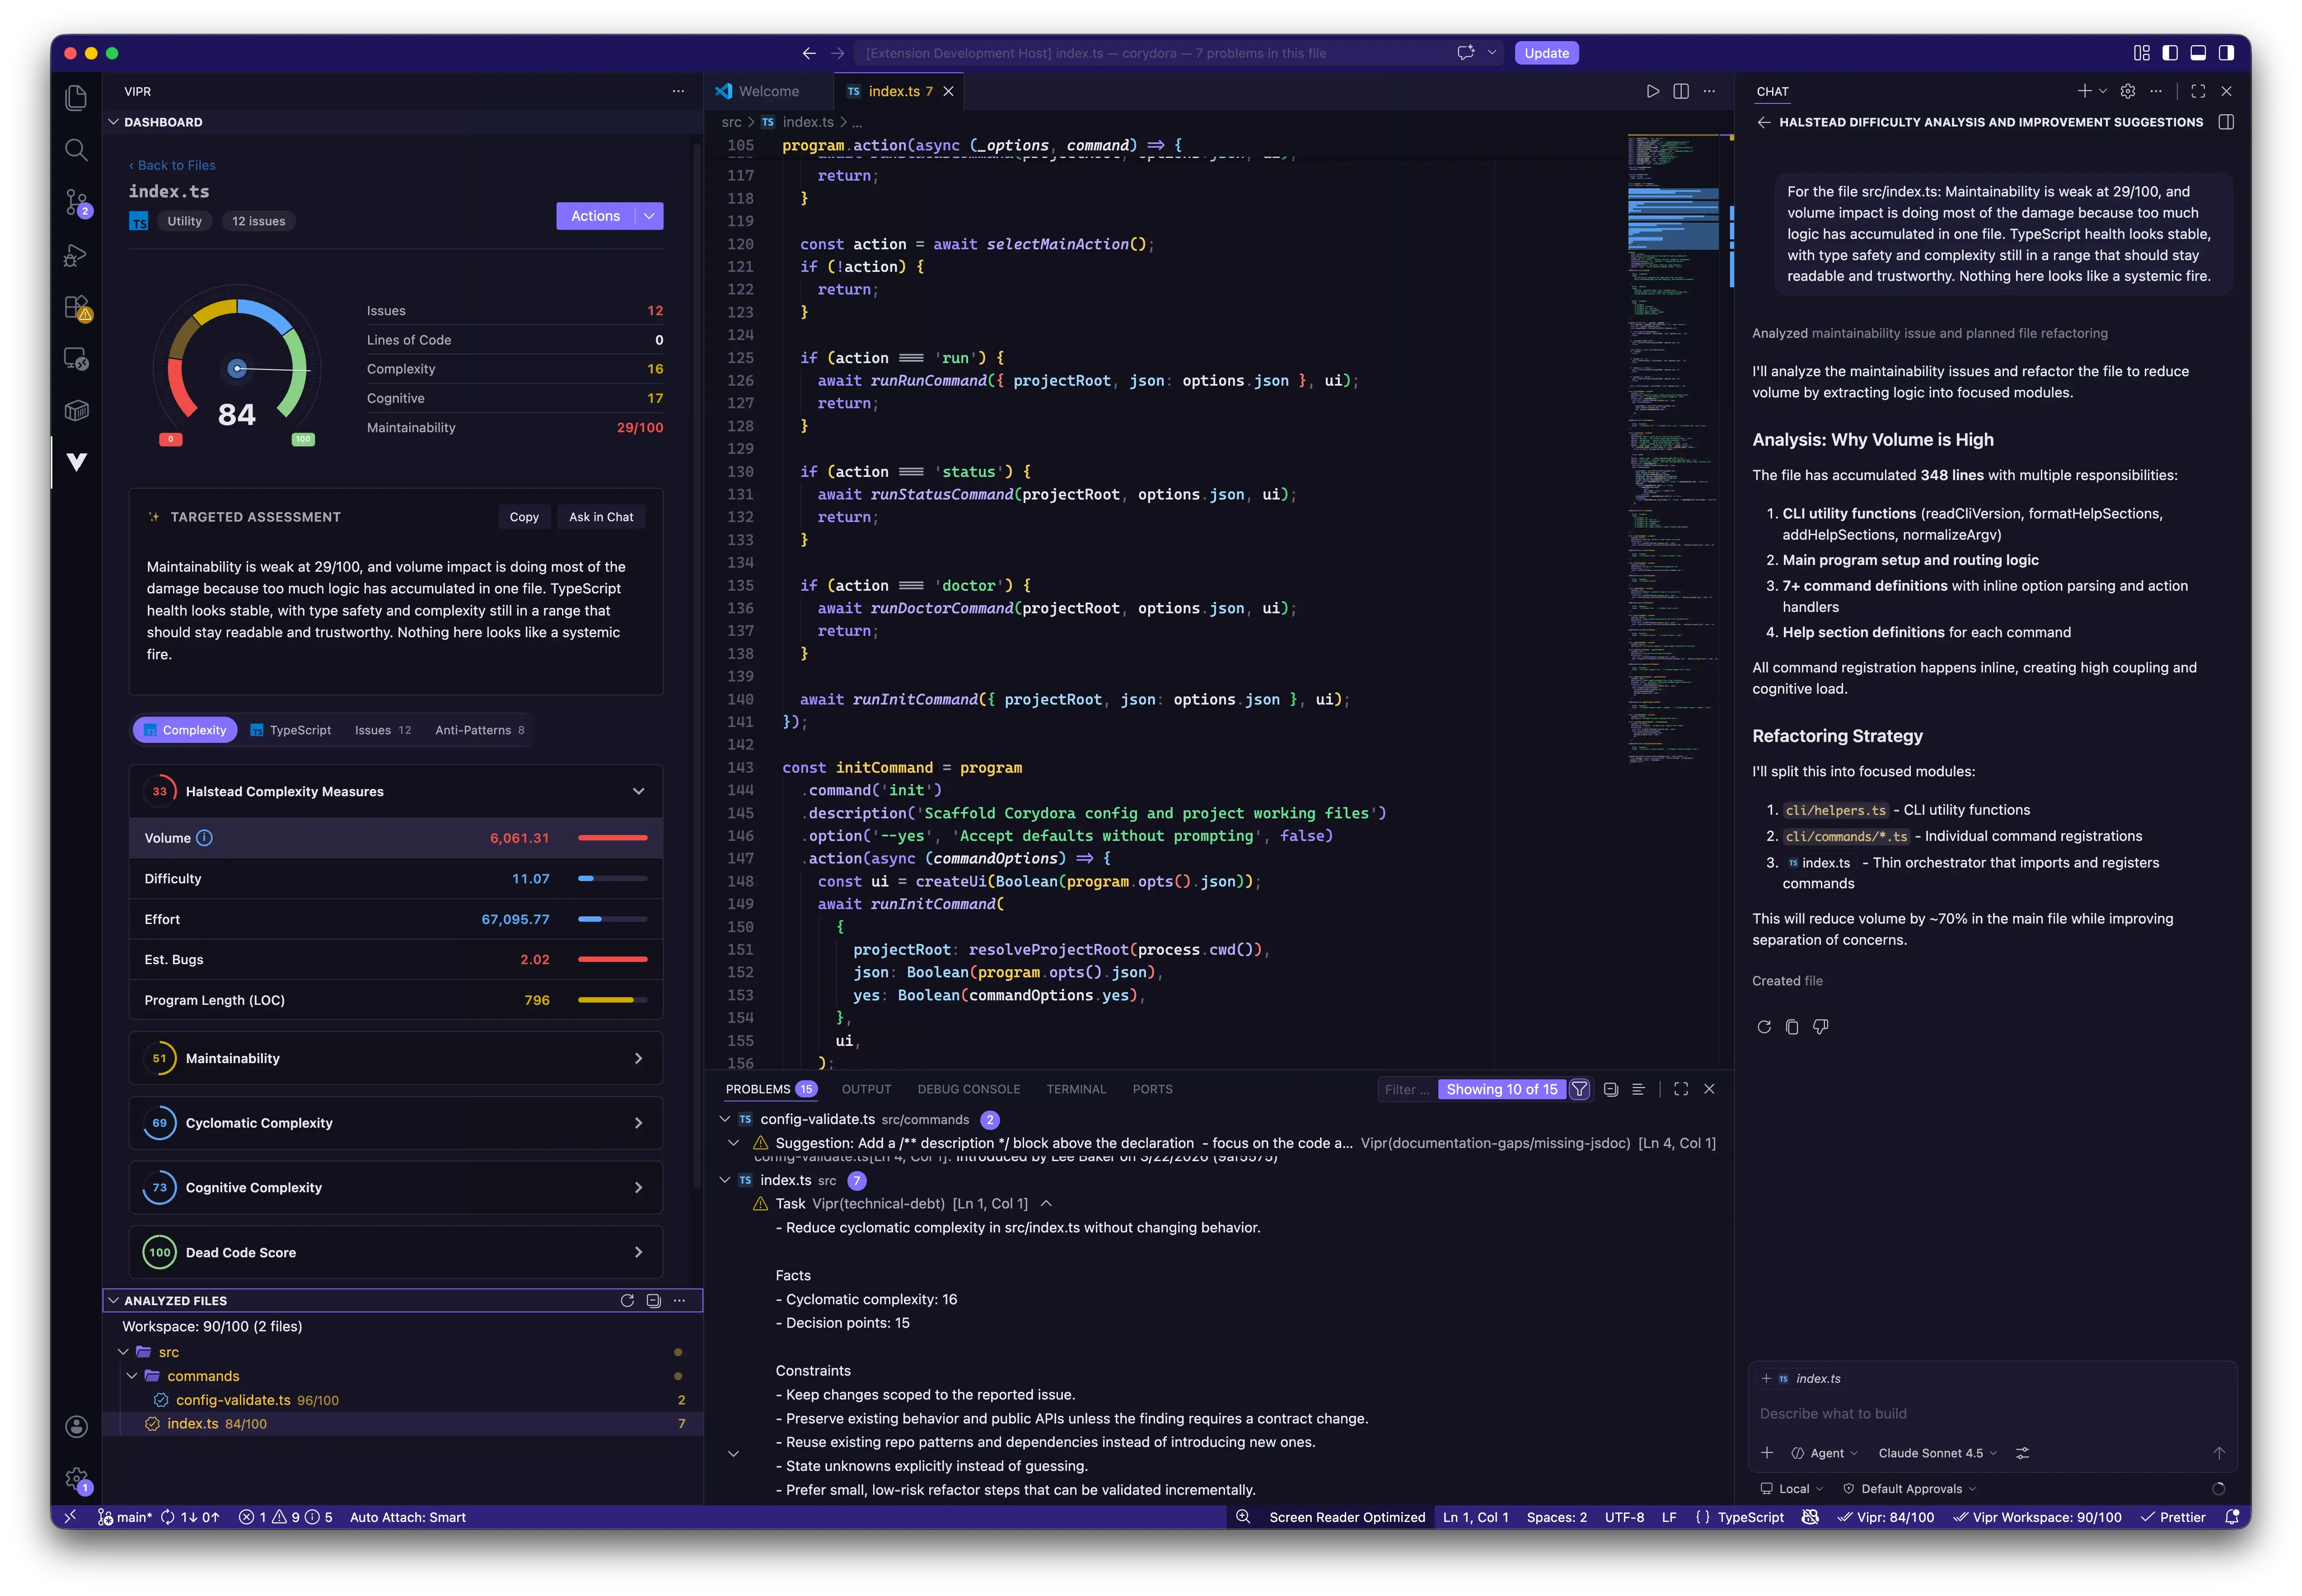
Tabs run across the top: Anti-Patterns, React, TypeScript, Issues, Complexity. Each one collapses into metric groups with a small radial showing the group's rating.

Open one and you get the raw values, the threshold, and the "aim for under X" line. No dashboards to build, no thresholds to configure.

Switch tabs for TypeScript, Issues, and Anti-Patterns. Same pattern: group, gauge, expand for raw values.

Inside the editor

The reports that ride along with you.

Eleven framework-aware reports, grouped by what they actually analyze. Each one runs as you edit and surfaces in the same panel beside your file tree.

Core complexity.
Cyclomatic and cognitive complexity, Halstead volume, maintainability index, and dead-code detection. Per-file scoring on every file you open. No thresholds to configure, no framework assumptions baked in.
TypeScript.
Nine reports on type safety, generics, declaration shape, and structural quality. Catches the `as unknown as T` double assertion, `@ts-nocheck` suppression, exported functions without explicit return types, and missing exhaustiveness checks on discriminated unions. The things `tsc` accepts without complaint.
React.
Five reports covering accessibility, anti-patterns, performance, reliability, and security. Catches lifecycle misuse, hook ordering, XSS vectors, and the unsafe-prop bugs your linter walks past.
Next.js.
Five reports for data fetching, rendering, route structure, security, and the server/client boundary. Flags 'use client' / 'use server' misuse, RSC violations, and unsafe redirects in middleware.
The Vipr panel beside the file tree, showing analysis reports for the open file

What's Free, What's Pro

Free shows you this file. Pro shows you what it's becoming.

Free is the editor integration: diagnostics, hover cards, the dashboard panel. Pro is the time axis. Eleven framework-aware reports, file history, save-time deltas, and CodeLens scores on every function.

Free

$0 · forever

Diagnostics in the Problems panel. Hover a symbol, see the issue. The dashboard tab opens beside your file tree and updates as you edit. Enough to catch the obvious things in the file you're in. Free forever, no account.

  • Inline diagnostics + hover cards
  • Dashboard panel docked beside the file tree
  • 3 report tabs, 3 anti-pattern categories
  • Works in VSCode, Cursor, Windsurf, any VSCode fork

Pro

$49 once · 3 devices

The reason you'd pay. Every metric group expands to the raw numbers and the threshold you're measured against. React anti-patterns, hook integrity, type safety, server/client boundary, plus the complexity scores other tools stop at. Eleven framework-aware reports. CodeLens scores per function. File history so you can see when a number started moving and which commit moved it.

  • 11 reports across React, Next.js, and core JS/TS
  • CodeLens scores on every function
  • File history, save-time deltas, threshold alerts
  • Functions tab, full anti-pattern catalog, metric docs
  • Targeted Assessment + Desktop deep-link companion

One-time. Three devices. No renewal. Yes, really.

Companion theme · free

And a theme tuned to match.

Vipr Theme is a separate free extension: nine color themes (dark, light, high-contrast, violet, warm, cool, minimal) and a matching file-icon set. Designed alongside the Vipr UI so the editor, the extension, and the desktop app all feel like one product.

App.tsx
// Vipr Dark Violet
import  useMemo  from 'react';

export function Dashboard( health : Props) 
  const score = useMemo(() => computeHealth(health), [health]);
  return <RadialGauge value=score />;

9 color themes · 1 icon set

  • Dark
  • Dark Violet
  • Dark Warm
  • Dark Cool
  • Minimal
  • Light
  • Light Violet
  • Dark HC
  • Light HC

Theme ships alongside the extension when we exit alpha.

Go deeper

VSCode is where you code. Desktop is where you understand.

The extension catches issues as you type. The Desktop app shows you what's changing over time, where it's concentrated, and what to fix first.